When analysing skills requirements many parameters must be gathered before profiles and trends will offer clarity in terms of the needs versus the numbers! The key graphs used to understand challenges or predict future trends or requirements are discussed below.
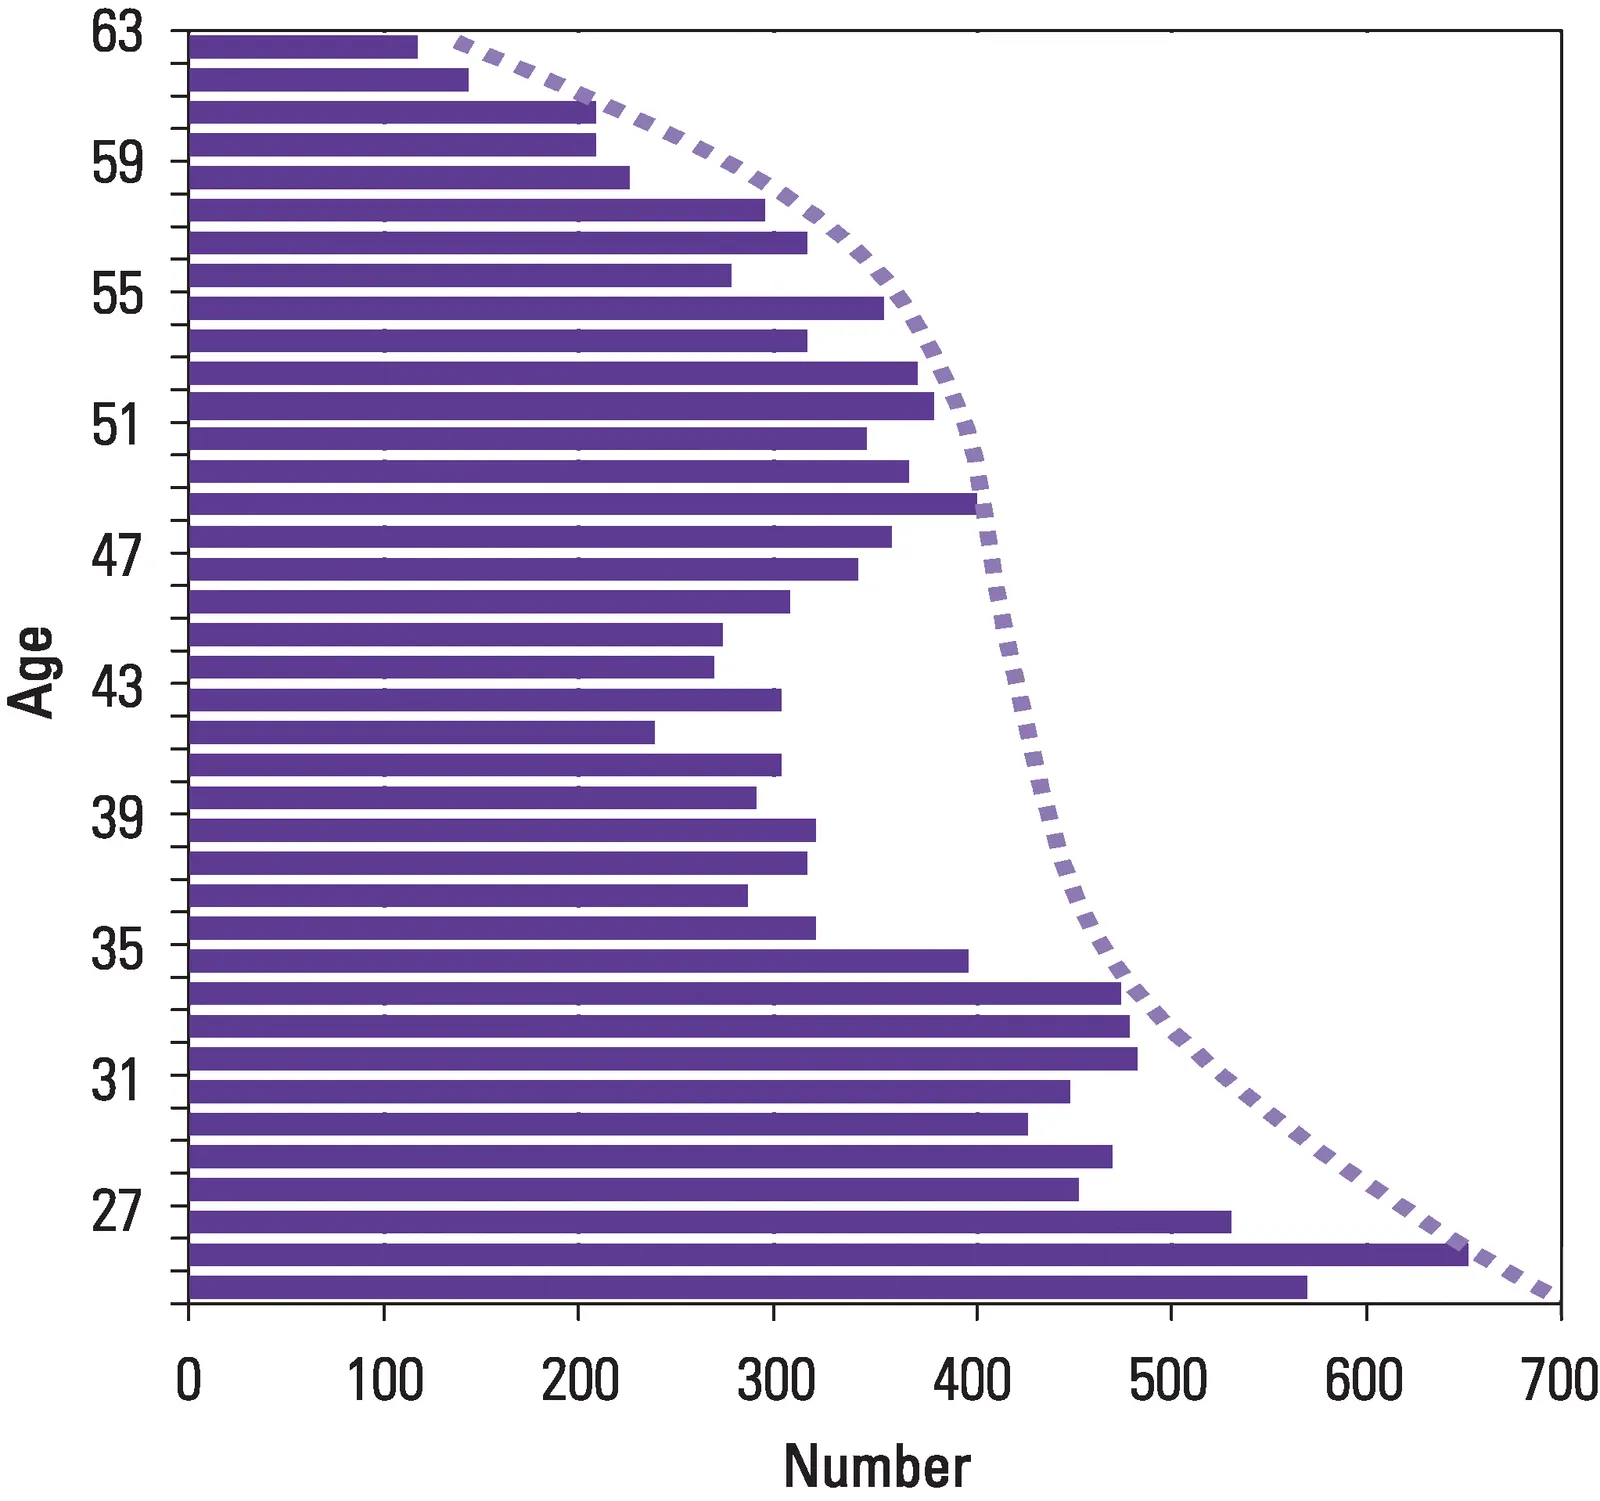
The population pyramid gives a clear picture of a population’s age composition and gender composition if included. An engineering population should typically follow a normal distribution allowing for losses along the way for those leaving the industry, emigrating or passing away. Gaps as shown in this pyramid indicate a shortage of mid-career staff, hence increased workloads and insufficient numbers to develop into tomorrow’s leaders. Furthermore, with such pressures, experienced personnel will have little time to coach and mentor the incoming cohorts. Such a profile will require many interventions, including the use of retired engineers to coach and mentor, and the use of international expertise to bolster the production team on large projects.
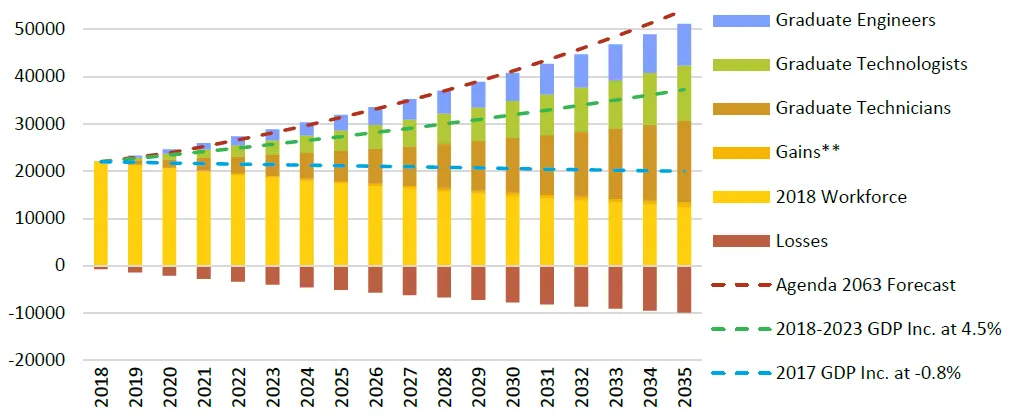
The current workforce, in this case in 2018, is not static but is affected by the flow of people exiting and entering the workforce. The losses include those emigrating, retiring, moving to other industries or passing away. The gains include recent graduates entering, retirees or those who left returning, and immigration. The number required is, however, dependent on economic growth and associated demand. The model under consideration looked at the projected growth in the SADC region of 6% to 2020 and 8% thereafter, as forecast under Agenda 2063, which would indicate that increased graduations at 2% per annum could be accommodated. However, most countries have not attained that level of growth and some economies have shrunk. Under these conditions, the unemployed graduate phenomenon becomes a problem as shown, considering the 4.5% and -0.8% growth. Before increasing the number of students, opening new universities, etc. forecasting the long-term needs is essential. Current employment data, emigration, immigration, morbidity, graduation trends and economic data must be considered.
Changing the profile of the engineering profession cannot be an overnight exercise. Since the emergence of the modern-day engineer in the 18th century, engineers in the Western World have largely been white males. The development of an engineer is a lifelong process, from higher education to workplace training after graduation, to becoming competent professional engineers, and growing to be proficient and eventually industry experts. Such a combination of personnel is needed to ensure there is innovation, leadership and older and wiser engineers to develop graduates. Changing the profile of this community requires transformation – from student enrolment all the way through to the development of experts, a process which takes some 25 years. The graphs below show the progression in the case of gender and race, and would also apply when striving to increase the number of indigenous engineers to replace the expat community.
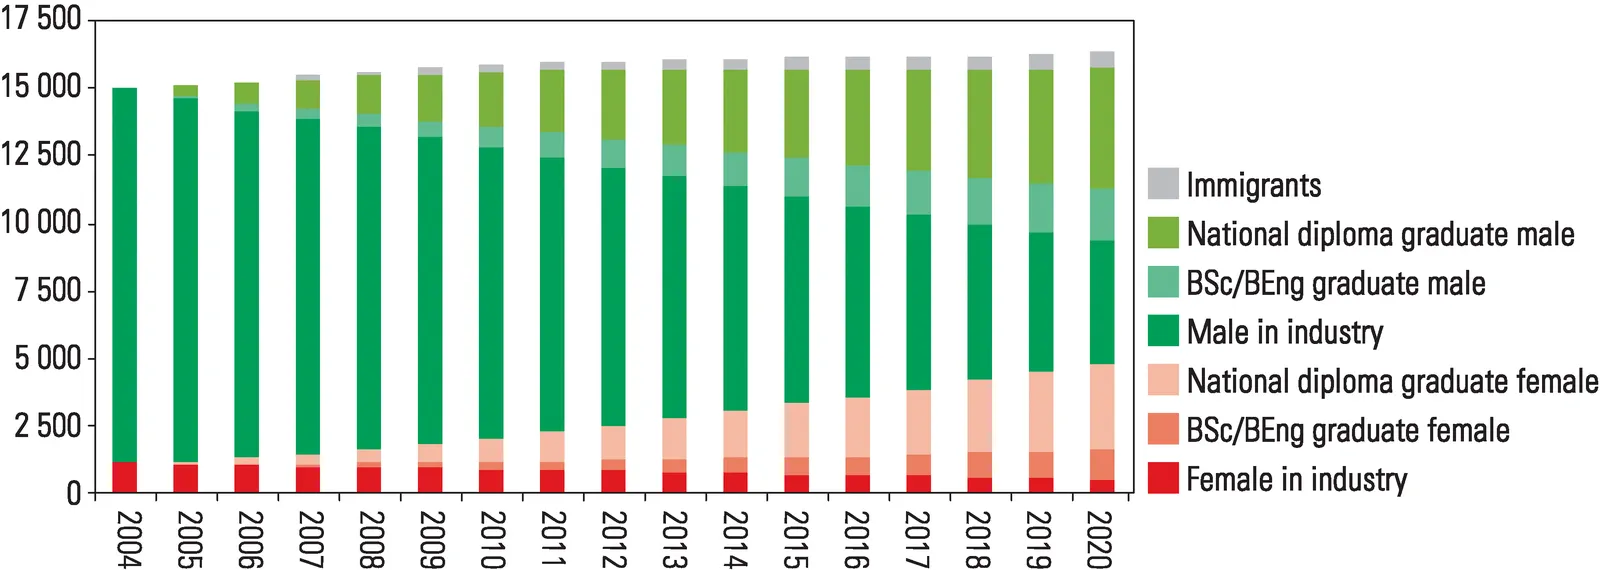
Gender transformation is a long journey as the ramp up from limited participation to full participation requires female graduation rates to increase to feed the system. The model created in 2004, at which time women represented 5% of the civil engineering workforce, assumed that the graduation rate across the board would reach 50/50 by 2015, hence the increasing number entering the workforce, replacing some of the male population leaving for various reasons. Given the numbers of males who have in the past made up the industry, it can be seen that even with 50/50 graduations, females would only grow to a third of the workforce. Extrapolating further, it was determined that 50/50 could not be achieved in South Africa before 2030. Sadly, graduation rates did not achieve 50/50 by 2015, hence industry achieved slightly less than 20% by 2020.
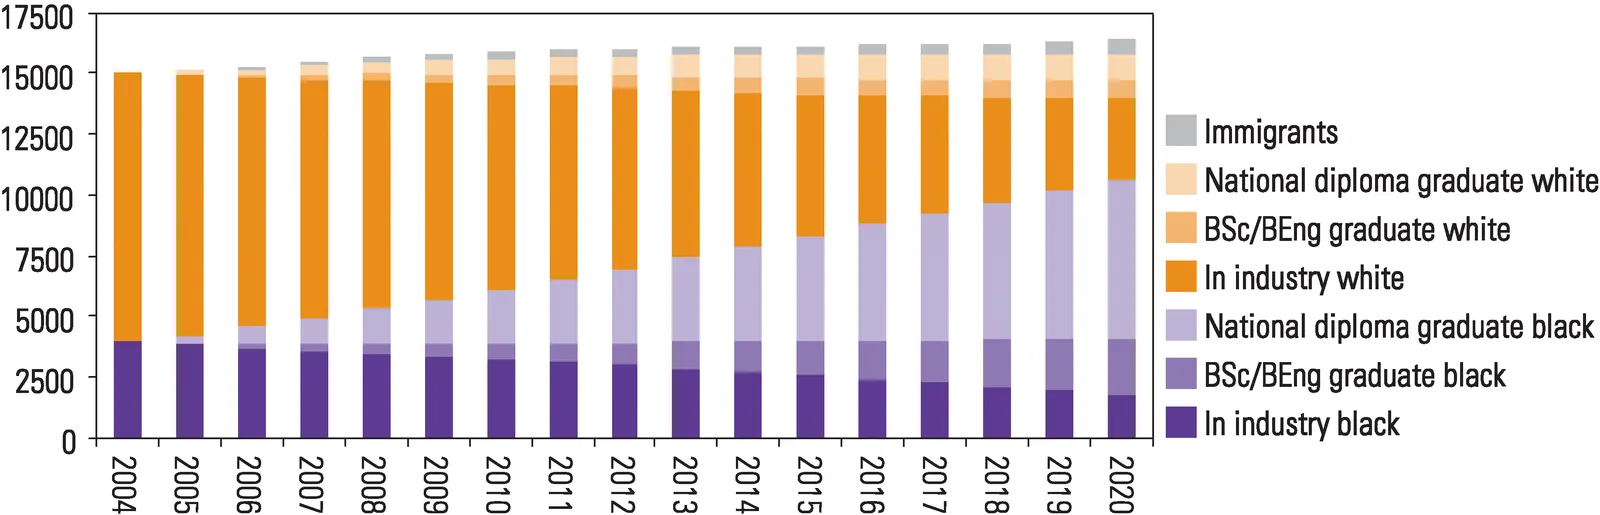
The dominance of white, male engineers and expats in many countries has required transformation in terms of race and the involvement of local engineering personnel. This, too, is a long journey as the ramp up from limited participation to full participation requires graduation rates representative of the country’s demographics to increase in order to feed into the system. The model created in 2004, at which time black civil engineering practitioners represented 25% of the workforce, assumed that the graduation rate for technicians would be representative of South Africa’s demographics by 2011 and for engineers by 2015. Based on this assumption, the profile by 2020 would have reached only 70%. The technician rates have largely become representative of the demographics, but the engineer graduation rates have trailed behind due to the limited number of black school leavers who have achieved the level of maths and science required for entry into degree programmes. Until the schooling deficit is addressed there will continue to be an imbalance in the ratio of black to white engineers in South Africa.